
Visualize your projects and follow progress
Automatic graphing and reporting of your projects data. Gantt diagrams, calendars, PERT, load plans and more.
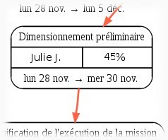
Progress tracking
As soon as your project gets started, AtikTeam allows you to track and report progress on tasks, phases and projects. In collaborative mode, each worker can report progress on his work, and data gets automatically aggregated upward.
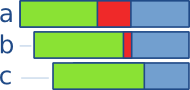
Gantt diagram
You will then have a nice Gantt diagram automatically generated for each project, illustrating the start and finish dates of your planning parts. Additionally, an overall Gantt diagram is provided, covering all your projects in a single page.
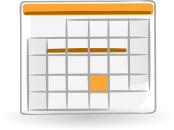
Calendar
To follow activity on a monthly basis, a calendar is also provided. You can use it to display the activity for every projects or for a specific project. You can also select whether to display only your tasks, or everybody’s taks.
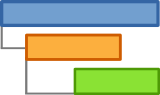
Flow chart
Project management complexity can rapidly increase if some pieces of information are missing. To help you keep ideas clear, AtikTeam automatically provides a flow chart of your project, showing both the big picture, and the local important details.
Load plan
Effective project planning must consider workers availability, as a decisive resource for tasks achievement. In addition to vacation handling, AtikTeam provides an automatic load plan, showing availability of the people of your teams across days, weeks or months.

Improve your accuracy